Glenndle Sim, in his chairman's message in Mencast Holdings' Annual Report 2012, gave an in-depth description of the company's long-term targets. They are big hairy audacious goals which are well analysed and assessed, possibly with the help of advisors, in the message. The full-blown annual report can be accessed at the SGX website. Excerpts:
 Glenndle Sim, executive chairman and CEO of Mencast Holdings. Photo: annual reportBHAG 2020: $1 billion market capitalization and $50 million NPAT
Glenndle Sim, executive chairman and CEO of Mencast Holdings. Photo: annual reportBHAG 2020: $1 billion market capitalization and $50 million NPATTo be meaningful, any measure of success must be quantifiable.
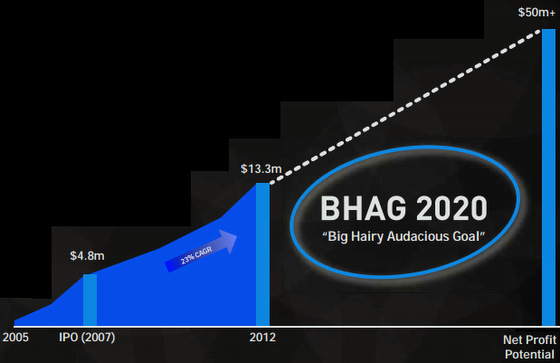
As such, I have set with my management team the twin targets of $1 billion in market capitalization and net profit of $50 million by 2020. This is our “Big Hairy Audacious Goal” 2020 (“BHAG 2020”).
From our current position, BHAG 2020 is clearly a big goal, but how audacious is it? Growing our market capitalization and net profit at the same rates as since listing would see both goals achieved in seven years – that is in 2020.
What makes our goal “hairy and audacious” is executing a strategy to sustain our present growth rates seven more years.
While doubtless a challenging goal, we have set BHAG 2020 as more than just a vague target. It is built around a real business plan that seeks opportunities while systematically leveraging the key value drivers of our firm.
Businesses must pay homage to the three basic value drivers - revenue, margins and value creation. The former two represent the building blocks of profit, whilst the latter ensures that
returns exceed the cost of providing those returns. Let’s look at what each value driver
means to us in turn.
Revenue
Revenue
During the year, our Group added significant new capacity to cater to growing demand for our services. This is now operational and being utilised. Our MRO business globally continues to benefit from the industry trend of outsourcing, higher quality standards and increased environmental awareness.
Outside Singapore, where our business will continue to grow significantly, there are also tremendous growth opportunities.
Over the next few years, our Group will expand to huge markets such as Middle East, Batam, Thailand and Vietnam. Each of these markets has a revenue potential of 2-3 times that of Singapore, and their combined addressable value is well in excess of US$2 billion.
Over the next few years, our Group will expand to huge markets such as Middle East, Batam, Thailand and Vietnam. Each of these markets has a revenue potential of 2-3 times that of Singapore, and their combined addressable value is well in excess of US$2 billion.
As well as increasing our revenue, international expansion also deepens our “moat” against competition by allowing us to enhance our service, response and support to our existing customers, most of which are already global in operations.
There are also a number of adjacent revenue opportunities we are exploring. Adjacent opportunities allow us to cross sell, leverage existing capabilities and share existing costs - a potent combination of synergy and reduced execution risk. Moving into adjacent sectors has been a highly strategy for our Group, and 78% of our FY2012 revenue was from areas developed since our IPO.
Our strong results over the past few years were enhanced by effective M&A. With 5 value accretive acquisitions in as many years, our ability to identify, acquire and integrate synergistic companies is a core competency. Mencast will seek acquisitions that are strategically
valuable to our existing core business and earnings and value accretive.
At a time when our fellow yards hold order books worth tens of billions of dollars, the extensive capacity headroom unlocked from our new facilities at 42E Penjuru Road (+50% in 2013 alone)
stands us in good stead for the year. Combined with excellent customer response and robust market conditions, we see many opportunities to build sustainable value in the years ahead.
Margins
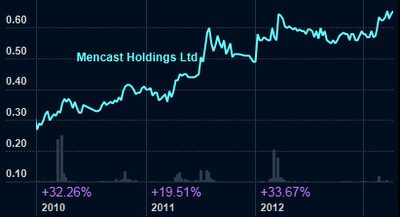 Mencast stock price has doubled since 2010 and now is at a historical PE of 10.3 X and 1.85% dividend yield. Market cap is S$147 million -- still quite a long way from the company's S$1 billion target. Chart: FT.comOur goal is that each of our divisions must be recognized as a leader in its domain. This provides a strong base to build our expansion. Higher revenue also contributes to margins by increasing
 utilization of our plant and machinery and enhancing scale economies.
To drive profitability, we continually scrutinize operational processes for efficiency and productivity. Apart from production processes, we also take great care to establish an efficient and lean cost structure.
Over the past three years, our aggressive investment in capacity and processes has increased overhead costs per unit of sales. This rate of increase is plateauing, and depending on future business mix, may even reverse as we complete our current expansion phase at the end of
this year.
Whatever lies ahead, we aim to deliver industry leading margins in all our divisions.
Whatever lies ahead, we aim to deliver industry leading margins in all our divisions.
Capital Spread
To ensure that all our businesses use shareholder funds efficiently, our Group closely tracks the spread between our return on capital and our cost of capital. In each year since our IPO, this spread has been solidly positive.
A closer analysis, however, shows we could accelerate the share of value accreting to shareholder through increased use of debt funding in the future.
Let me explain. Since our IPO, total assets have grown by $173 million. Approximately 21% of these assets were funded by debt, 23% by shares and the balance of 56% from internal cash flow.
This is a conservative financing mix, reflecting the prudence developed over three decades as a management owned company as well as the turbulent post-Lehman financing climate that
followed our IPO.
To grow as fast as we wanted, there was little choice but to issue shares as we had an equity base of just $21 million in 2008. Expanding during the down cycle has proven to be very successful with an independent valuation showing that our industrial properties – the bulk of which were acquired post IPO – are worth $32 million more than what we paid for those
properties.The large bulk of our capital spending for 42E Penjuru Road will be over by the end of this year. Barring a major new growth initiative, our Group will enjoy a large increase in free cashflow after this.
At this time, our gearing ratio is 31%, which would fall to 25% should we decide to take $32 million of revaluation gain on our properties through the balance sheet. Our current equity base and cashflow today has grown large enough to fund expansion close to the size of that of the last 5 years without any additional share issuance.
The uncertain economic conditions immediately following our listing in 2008 (i.e. post-Lehman crisis) and initially depressed equity markets resulted in our asset acquisitions being funded at a
relatively high cost of capital. Moving ahead (again barring new initiatives or major acquisition), we plan to move towards more debt funding and less share issuance.
This will dramatically increase the share of earnings gains attributed to shareholders.
This will dramatically increase the share of earnings gains attributed to shareholders.
Sustaining the Momentum
Our Group took the opportunity during the downturn to invest in new capacity and this has served us well. Robust market conditions and our position as Asia’s No.1 MRO service provider also
give us confidence that our growth momentum can be sustained in the years to come.
However as Laozi (冾ᗸ) wisely noted, every journey is undertaken a step at a time. The steps we will focus on in the current year are outlined above. Over the course of the year and in future Annual Reports, I look forward to sharing more about how our plans are progressing.
Recent story: MENCAST: Targeting to be S$1-billion company by 2020
Recent story: MENCAST: Targeting to be S$1-billion company by 2020