| Iron ore prices have traded at very high levels in the past year or so, benefitting Singapore-listed miner Southern Alliance Mining (SAM). A substantial portion of its iron ore concentrate is sold to steel mills in Malaysia for the production of steel products such as bar rods, wire rods and H-beams.
1) The mine had 5.6 million tonnes of reserves as at end-FY20 (ended July). About 1.2 million tonnes were extracted in FY20. Using this rate, the 5.6 million reserves would be exhausted around FY24. (This does not take into consideration "inferred resources" of 1.8 million tonnes.) 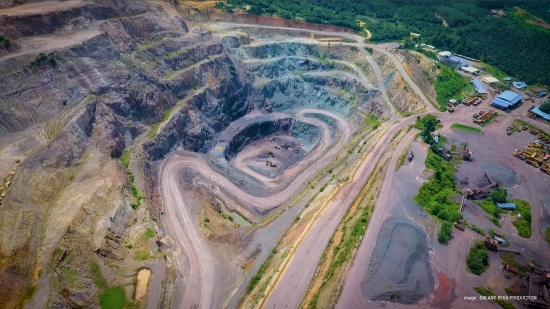 Southern Alliance Mining has been operating the Chaah Mine in Johor since 2008. Photo: Company Southern Alliance Mining has been operating the Chaah Mine in Johor since 2008. Photo: Company |
2) The FY20 pre-tax profit was RM87 million -- which is a cool pile of money, reflecting high demand and weak supply in the global iron ore market.
Assuming similarly elevated ASPs, the potential pre-tax profit is RM400 million (S$133 million) cumulatively until the concession expires.
3) The estimated pre-tax profit is lower than the current S$150 million market cap of SAM (based on 30-cent stock price).
Does that imply SAM's market cap has little or no upside? 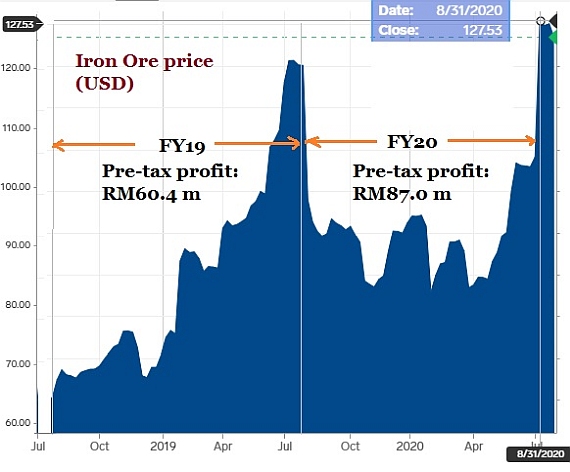 How market price of iron ore relates to Southern Alliance Mining's pre-tax profit.
How else might SAM be able to further create shareholder value?
We asked SAM's CFO, Lim Wei Hung, to guide investors on how to navigate these questions. This is how it goes:
| The reported reserves as at 31 July 2020 were 5.6 million tonnes -- but this is a dynamic figure. It goes down as some iron ore is extracted and goes up as discoveries are made of more iron ore in the ground. The key Chaah Mine (226 hectares) is only about a third explored. SAM has been conducting drilling at its mine, which is in Johor, to uncover an extension of the ore body. Fortunately, it has recently reported discovering massive "hematite mineralization" in one of two extension drill holes. Work continues on the other drill hole. The geological data will be evaluated by its experts, and SAM is expected to subsequently announce additional tonnage of "indicated resources". To recap, as at 31 July 2020, SAM reported it had "indicated resources" of 5.5 million tonnes, and it had 5.3 million of reserves. It also reported 'inferred resources of 1.8 million tonnes (which were not converted into reserves). The 5.3 million tonnes of reserves came from the "indicated resources" -- that's a 96% conversion rate. The high rate reflects its experts' evaluation and high confidence that the resources can be economically mined based on a number of criteria. These include the cost of extraction, the grade of the iron ore, and the market price of the ore. For "indicated resources" to be upgraded to "reserves" the net present value has to be calculated to be a positive figure. Hypothetically, any mine may report large "resources" but relatively low "reserves" because of unfavourable economics. |
|
Total iron ore reserves (31.7.2020) |
|
|
Category
|
Tonnes* (Mt) |
|
Probable (in situ) |
5.3 |
|
Probable (stockpiles) |
0.2 |
|
Probable (tailings) |
0.1 |
|
Total (in situ) |
5.3 |
|
Total |
5.6 |
|
*Gross attributable to license and net attributable to issuer |
|
Aside from the 5.3 million reserves, which are in the ground, SAM also reported:
• 0.2 million tonnes of reserves in its stockpile and
• 0.1 million of reserves in its tailings.
Thus the total = 5.6 million tonnes of reserves as at 31 July 2020.
The reported figures for reserves and resources are estimates.
How accurate they are can be ascertained by comparing the resource model -- which uses geological data -- with the actual production.
As an analogy, you walk into a dimly-lit warehouse of goods and you make estimates of the quantity.
It's when you ferry out goods from a defined area of the warehouse and view them in broad daylight that you can know if your earlier guess is correct.
SAM has produced data from reconciling its production with its resource model. (See page 11 of the Powerpoint presentation here)
Conclusion: SAM's resource model has been pretty credible. In other words, the stated 5.6 million tonnes of reserves are very likely to be unearthed over the next few years.
|
Total iron ore resources (31.7.2020) |
|
|
Category |
Tonnes* (Mt) |
|
Indicated (in situ) |
5.5 |
|
Indicated (stockpiles) |
0.2 |
|
Indicated (tailings) |
0.1 |
|
Inferred (in situ) |
1.8 |
|
Total (in situ) |
7.3 |
|
Total |
7.6 |
|
*Gross attributable to license and net attributable to issuer |
|
In addition, SAM has declared "inferred resources" of 1.8 million tonnes as at 31 July 2020.
This is resource which is inferred to be in the ground based on a limited number of drill holes.
To upgrade the 1.8 million tonnes to "indicated resources" would require more drilling and time -- and SAM has decided to focus instead of drilling for an extension of the ore body.
Furthermore, SAM says it has reasonable confidence that a large portion of its "inferred resources" can be monetised as has happened in the past.
| Bottomline: The market value of SAM theoretically should reflect • the 5.6 million tonnes of reserves, • the 1.8 million tonnes of inferred resources, • the minor quantities in stockpiles/tailings, and • as-yet-unreported resources being discovered in an extension of the ore body. In addition, SAM is exploring for iron ore for the first time in three other concessions in Johor. |