I read my end-Aug 2014 bank statement with a sigh -- the market value of my share portfolio bought with Central Provident Fund (CPF) savings continued to hover around the S$130,000 level where it was last year.
In my article in July last year (INVESTOR: How My Stocks Bought With CPF Savings Have Done (2013)), it was $132,232.
Has it in fact gone down?
Actually no, as I learnt with relief after computing the dividends.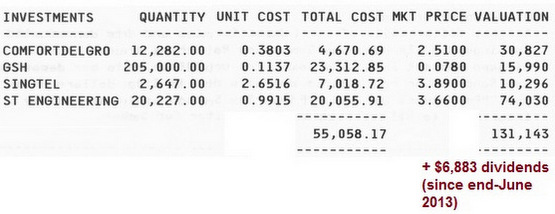 Screenshot of bank statement for end-August 2014: The $131,143 valuation does not include $6,883 in dividends derived from: ComfortDelGro: $1,320; SingTel: $708; ST Engineering: $4,854.
|
In my 2013 article, the value of my portfolio was $132,232 while the dividends amounted to $4,652 from ComfortDelGro, SingTel and ST Engineering. Total: $136,884. |
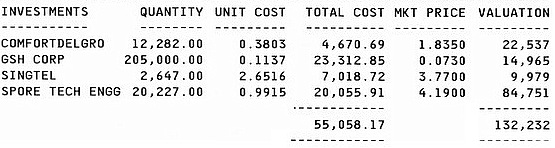 Screenshot of bank statement as at end-June 2013.