Photo: SDB
Translated by Andrew Vanburen from a Chinese-language piece in Economic Info
MONEY RULES THE WORLD.
And apparently nowhere moreso than on China's stock exchanges.
Of the 1,336 PRC-listed firms reporting their 2011 annual results to date, a shocking figure comes to light – just a dozen of these listcos, all of them banks, account for over a half of the total reported bottom lines for 2011.
How did they manage this?
First let’s give some scale to the story.
The total combined net profit of the 1,336 PRC-listed companies already releasing their full year earnings comes to 1.64 trillion yuan, up 13% from 2010 levels.
Of this total, just 12 listed lenders reported a combined bottom line growth of 29% to 842 billion yuan.
However, when looking at the net profit growth rate of non-bank related listed firms overall, we see a much more revealing picture, as the year-on-year increase in 2011 is virtually non-existent, and in fact dropped by around one billion yuan to just over 800 billion yuan.

Another way of looking at these rather startling findings is that just 0.89% of the 1,336 firms already reporting results are from the banking sector, yet these 12 lenders alone are responsible for 51.3% of the bottom line combined total for all listcos last year.
Of these 12 standout banks, the worst performing of the pack still would be the envy of the non-banking sector.
Bank of China Ltd (SHA: 601988) saw its 2011 net profit grow 18.9% year-on-year.
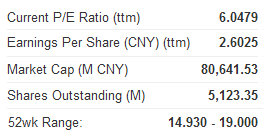
Meanwhile, the leader of the pack of 12 – at least for 2011 – was Shenzhen Development Bank Co (SDB) (SZA: 000001) which boosted its bottom line by 64.6% to 10.3 billion yuan.
In fact, of the dozen banks highlighted, seven reported 2011 net profit increases of over 30%.
For the entire banking sector, we need to look to the industry regulator – the China Banking Regulatory Commission (CBRC) – which said that in 2011, the combined net profit of all PRC-listed lenders reporting earnings to date stood at 1.04 trillion yuan, up 36.3% year-on-year.
Over this same period, profit margins in the industry rose to 20.4% compared to 19.2% in 2010.
For comparison’s sake, the National Bureau of Statistics (NBS) recently said that the total net profit tally for industrial-related enterprises (listed or otherwise) stood at 5.45 trillion yuan.
Meanwhile, the country’s total 2011 GDP grew to 47.16 trillion yuan, up from 40.15 trillion the year prior, adding some seven trillion yuan in output over the 12-month period.
Of this, the banking sector contributed 14.9% to the total in China.
An authoritative industry source helped to explain why the country’s banks were playing such a seemingly disproportionately large role in the country’s economic growth.
“The assets of listed banks grew at a healthier and more robust pace than the overall banking sector last year primarily due to a higher quality of assets. The loan and asset quality of listed lenders has clearly outshone that of their non-listed banking peers.
"Thus it becomes clear why banks listed in Mainland China have shown such vibrant bottom line performance last year, and this is especially true for the country’s so-called ‘Big Five’,” the source said.
China’s “Big Five Commercial Lenders” are: Industrial and Commercial Bank of China, Bank of China,China Construction Bank, Agricultural Bank of China and Bank of Communications.
Back in 2009, a breakout year for loan growth across the sector for every quality of lending activity, the CBRC got a bit nervous and put its foot down, requiring the “Big Five” to raise their bad loan coverage ratio by the end of that year.
Judging by the take home pay of the 12 super-performing banks last year, they were apparently listening to the advice from above at the time.
See also:
What’s Really Behind China Share Rally?
Funds To Fuel Further A-Share Frenzy
CHINA MARKET: Unraveling The A-Share Ascent