ComfortDelGro drops back to pandemic lows! What gives?
| On 1 Sep, it was announced that ComfortDelGro (“CD”) will drop out of STI after being first included in the STI on 28 Jul 2010. Subsequently, there was turmoil in United Kingdom (“UK”) gilts and currency as UK government led by Prime Minister Liz Truss unveiled a (surprisingly) GBP45b plan to reduce taxes (click HERE for more information). Although CD may see some near-term price weakness, at Friday’s close of $1.32 (CD touched an intraday low $1.29 at the point of writing this), I personally believe most of the negatives may have already been priced in. Why am I bullish on CD? Read on for my basis and the risks below.  |
Basis
a) Improving results
It is likely that CD may post stronger core results in the upcoming quarters as
- The removal of restrictions in Singapore was largely only from 29 April with more easing subsequently;
- There are numerous shopping, seminars, conferences and exhibitions (MICE) events in Sep such as Comex IT, Great Singapore Sale and F1 etc.
Based on its FY21 annual report, Singapore contributed 53.8% and 57.7% to group revenue and operating profit respectively;
- Rail ridership may benefit from the return to office and increase in social activities;
- Taxi rebates may end or reduce in Sep.
b) Compelling valuations
Based on Bloomberg, CD trades at 1.0x P/BV, almost two standard deviations below its 10Y average P/BV of 1.9x. FY22F estimated div yield is around 5.2%. Suffice to say CD trades at compelling valuations and seems to offer a good margin of safety.
Furthermore, shareholders are paid decent dividends while waiting for the company to deliver on its results and to be re-rated by the market.
c) Attractive dividend yield AND dividends are likely to rise over time
Based on Bloomberg, CD trades at an estimated dividend yield of around 5.2%. However, there is scope for CD to pay more dividends as its results improve over time. It is noteworthy that (pre-pandemic), CD paid $0.105 / share and $0.0979 / share in dividends in 2018 and 2019 respectively.
At $1.32, this works out to be around 7.4% - 7.9% dividend yield should it repeat such dividends in future.
d) Rock solid balance sheet, backed by net cash $643m
Based on 1HFY22 results, CD’s balance sheet has strengthened further. It has net cash amounting to $643m vs $493m in 1HFY21.
The strong balance sheet should be able to support dividends and any acquisitions for growth. Moreover, in a rapidly rising interest rate environment, ceteris paribus, a net cash company is generally likely to be less affected than a heavily leveraged company.
e) Chart – showing some green shoots of a potential near term recovery
Since Mar 2020, CD has been trading in a range of approximately $1.31 – 1.79. It has tested the lows of around $1.31-1.35 on numerous occasions throughout this period and rebounded. It is noteworthy that during the heights of the pandemic (where things are uncertain and gloomy), CD traded to an approximate low of around $1.31. It traded to an intraday low $1.29 on 30 Sep (Friday) before closing at $1.32. Based on chart, there are several noteworthy points on the trading seen on Friday.
- A potential bullish hammer formation seems to have occurred on Friday. However, we still require sustained follow through buying, coupled with volume expansion to confirm this bullish formation;
- Total volume of shares transacted on 30 Sep 2022 was around 19.2m shares. Excluding the turnover on 16 Sep 2022 (where it was effectively out of STI), 30 Sep marks the highest volume of shares transacted since 19 May 2022 --> Such high volume increases the veracity of this candlestick formation; - RSI hit an oversold level 21.6. Based on observation, since 2009, RSI typically rebounds after touching this level (excluding the pandemic period).
Near term supports: $1.29 – 1.31 / 1.26 / 1.24
Near term resistances: $1.34 / 1.36 / 1.38 / 1.40 – 1.42
f) Analysts are generally positive on CD; Average analyst target $1.74
Based on Bloomberg (graphic below), 11 analysts cover CD with 10 buys; 1 hold; 0 sells. Source: Bloomberg 30.9.22
Average analyst target is around $1.74. Coupled with an estimated dividend yield of around 5.2%, total potential return is around 37%
g) Not its first time to drop out of an index
This is not the first time that CD has dropped out of an index. At the close of 12 May 2020, MSCI announced that it would drop CD, SPH, Sembcorp Industries and SATs effective at the close on 29 May 2020. CD share price dropped from $1.60 on 12 May 2020 to $1.44 on 29 May 2020, before rebounding to $1.61 within three
trading days (i.e., on 3 Jun 2020).
The above example illustrates to some extent that being dropped out of an index does not constitute a death sentence.
Risks
a) Persistent share price weakness
Notwithstanding the compelling basis above, since Mar 2020, CD has been trading in a range of approximately $1.31 – 1.79. It has tested the lows of around $1.31-1.35 on numerous occasions throughout this period. CD is once again back at the lower end of the range. Some reasons for this persistent share price weakness may be:
- CD’s risk of being dropped out of STI has been there for quite some time. This may have resulted in tepid sustainable buying interest as buyers are worried of this overhang;
- On 30 Aug 2022, Pyrford International Ltd ceased to be a substantial shareholder of CD by selling 767,600 shares @approx $1.41. This reduces its stake to 4.995%, amounting to approximately 108.2m shares. As its stake has gone below 5%, it is not required to make any further reports should it sell more shares;
- Failure of its Australia subsidiary IPO to proceed. Click HERE for more;
- On 11 Nov 2021, it was announced that SBS Transit’s Downtown Line (DTL) will transition to New Rail Financing Framework Version 2 (NRFF (V2) (read HERE for more). The effect of which is outlined below in point c “decline in bus contracting revenue;
- Results have not yet improved tremendously at the moment hence market has not ascribed a high valuation on CD at the moment;
- UK, which CD has business in, was suddenly thrown into turmoil as UK government led by Prime Minister Liz Truss unveiled a (surprisingly) GBP45b plan in Sep to reduce taxes. In FY21 annual report, UK / Ireland contributed about 22.8% of group revenue.
Fortunately, in terms of FY21 operating profit (table below), UK / Ireland only contributed about 2.9% of the entire group’s operating profit. If a recession happens in UK, the impact to CD may not be as large as if it were to happen in Australia or Singapore.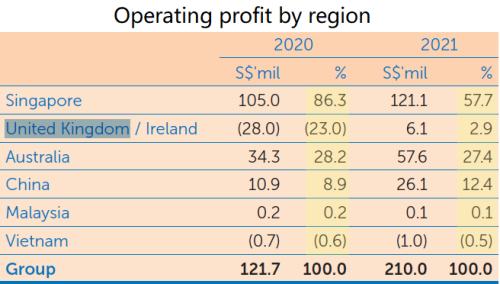
Besides the above potential reasons which may cast a pallor in its share price, there may be other reasons known to the market but unknown to me which cause the persistent share price weakness.
b) China likely to continue its zero Covid policy perhaps with some limited easing
In 1HFY22 results, CD set aside $10mn rebates to taxi drivers in various cities in China. Based on Phillip Securities report, its China operations suffered an operating loss of S$3.2mn in 2Q22. China seems to be continuing its zero Covid policy at the moment (perhaps with some limited easing). Thus, this segment may not improve that much in the near term.
c) Decline in bus contracting revenue effective 1 Sep 2022
Based on 1HFY22 results, CD shared that its Singapore Public Transport Services will also be affected by an amendment to the service fee payable by the LTA on 5 public bus contracts from 1 Sep 2022 to a rate that is benchmarked against recent bus tenders and is lower than the current service fee, as agreed as part of the
transition of the Downtown Line to NRFF 2. This has been made known to the public some time back.
d) May have some selling pressure in the near term
In the near term, besides the broad market weakness, CD may face some selling pressure as markets fret over the turmoil and repercussions from UK. Furthermore, we are not sure whether Pyrford International Ltd may continue its sale as it does not need to report of its sales anymore with its stake dipping below 5%.
e) Foreign currency exposure thrown into the limelight given GBP sharp decline
Based on this chart (click HERE ), GBPSGD has declined 12.1% from 1.8245 on 31 Dec 2021 to 1.6046. According to CD’s FY21 annual report, CD typically has a natural currency hedge in the regions which they operate in and also through active currency management using hedging instruments such as forwards and options where necessary.
Based on my reading of its FY21 annual report, I am not sure the actual impact of GBP’s decline to their bottom line but I reckon it will not be hugely significant.
Conclusion Ernest Lim, CFA, CA (Singapore)In summary, CD seems to be offering an attractive risk reward trade amid its improving results; strong balance sheet; attractive dividends and valuations etc. Ernest Lim, CFA, CA (Singapore)In summary, CD seems to be offering an attractive risk reward trade amid its improving results; strong balance sheet; attractive dividends and valuations etc. Nevertheless, it is noteworthy that in the near term, there may be some selling pressure as we are not sure whether Pyrford International Ltd may continue its sale and how the turmoil and repercussions in UK may pan out. |
For a more complete picture, refer to CD’s analyst reports (Click HERE ); SGX website (Click HERE ) and CD’s corporate website (Click HERE ). You can also refer to the article HERE on why analysts recommend to buy on recent share price weakness.
Readers have to assess their own % invested, risk profile, investment horizon and make your own informed decisions. Everybody is different hence you need to understand and assess yourself. The above is for general information only. For specific advice catering to your specific situation, do consult your financial advisor or
banker for more information
Readers who wish to be notified of my write-ups and / or informative emails, can consider signing up at http://ernest15percent.com . However, this reader’s mailing list has a one or two-day lag time as I will (naturally) send information (more information, more emails with more details) to my clients first. For readers who wish to enquire on being my client, please leave your contacts here http://ernest15percent.com/index.php/about-me/
Lastly, in line with my usual practice of compiling SGX stocks sorted by total potential return at the start of the month, readers who wish to receive my manual compilation of stocks sorted by total potential return can leave their contacts here http://ernest15percent.com/index.php/about-me/. I will send the list out to readers around 8 – 9 Oct 2022.
P.S: I am vested in CD.
Please refer to the disclaimer HERE