 Ernest Lim, CFA, CPAMALAYSIA’s Petronas has sharply increased its 2012-2017 capex to MYR300 billion, or 70% over the previous five-year period. A likely beneficiary of this is Nam Cheong Limited (“Nam Cheong”).
Description
According to an independent market research report by Pareto Securities Asia Pte Ltd., Nam Cheong is the largest shipbuilder of offshore support vessels (“OSVs”) in Malaysia and the second largest player east of the Suez Canal.
It has about 50-75% of the market share in Malaysia and 7% of the regional market share. It started shipbuilding in 1968 and has more than two decades of track record in building OSVs.
Since 2007, it has delivered more than 80 vessels. Examples of OSVs built are accommodation work barges, accommodation workboats, anchor handing tug supply (“AHTS”) vessels, Platform supply vessels (“PSVs”) and safety standby vessels (“SSVs”) etc.
Nam Cheong’s shipbuilding arm contributed more than 90% of its overall group revenue for the past three years. Its shipbuilding can be segregated into build-to-stock model (builds ahead of firm orders) and build-to-order model (builds vessels with contracts secured).
Besides shipbuilding, it also has a ship-chartering arm with a fleet of 13 vessels, namely two AHTS vessels, two landing crafts and nine SSVs.
Its headquarters is situated in Kuala Lumpur.  Nam Cheong's Multi-Purpose Support Vessel: These vessels offer sophisticated equipment and capabilities such as dynamic positioning, firefighting, cranes, moonpools, and helipads.
Photo: Company
Investment merits
Bright industry outlook
According to various market research, notwithstanding the weak shipbuilding cycle, the OSV sector is a buoyant sector to be in, especially in Malaysia.
It is common knowledge that Malaysia’s Petronas has sharply increased its 2012-2017 capex by approximately 70% to MYR300b over the previous five years. (See chart below)
This would fuel developments in marginal and deepwater field developments and increased exploratory activities. Such activities should bode well for Malaysia OSV operators such as Bumi Armada and Perdana Petroleum and consequently OSV builders such as Nam Cheong.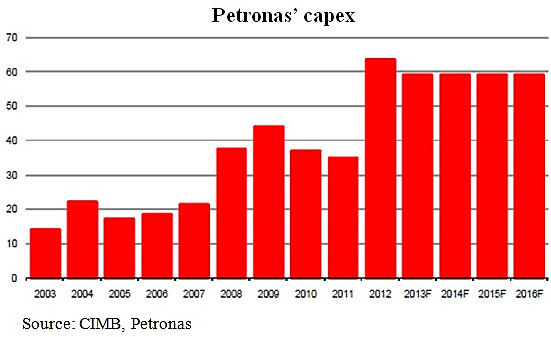
Secondly, according to the chart below, there seems to be replacement demand for AHTS and PSVs. About 37% of the world’s AHTS is older than the usual lifespan of 25 years.
It is noteworthy that the majority of vessels built in the early days (1980s) were arguably small-to-medium sized vessels due to low technical capability and requirements and are likely to be less fuel efficient. Vessel owners are showing increasing preference for younger and more fuel-efficient vessels. Consequently, this fuels replacement demand for AHTS and PSVs.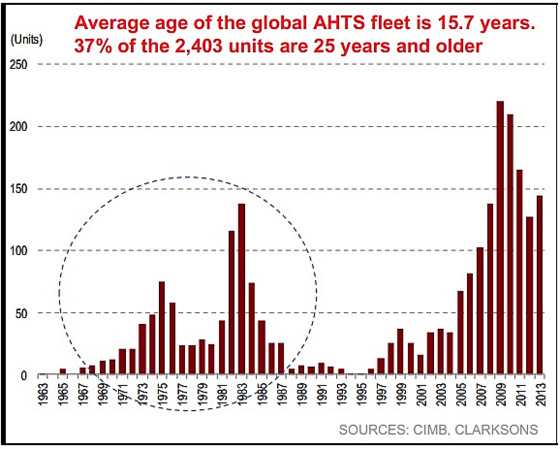
Build-to-stock business model with higher margins
Part of Nam Cheong’s shipbuilding business model is its build-to-stock model. It builds vessels in anticipation of orders, and sells them at a premium due to the short time to delivery. This is the main reason Nam Cheong can command enviable shipbuilding margins of 19-20% over the past three years as compared to high single-digit margins for its peers which do not have a build-to-stock model.
Strong earnings visibility
Nam Cheong’s net shipbuilding order book amounted to MYR1.3b (FY12 group revenue was MYR877m), thus this lends some visibility to its FY13F and FY14F results. In addition, Nam Cheong’s sales momentum remains strong. It has sold 13 vessels year to date as compared to the record 21 vessels in FY2012. (FY2011: 13 vessels) Typically, according to CIMB research, revenues tend to lag vessel sales by 1-2 years.
Risks
Inherent risks in their build-to-stock model
As Nam Cheong builds its vessels ahead of firm orders for its build to stock model, there is a possibility that it may end up with unsold inventory. Being in the business for decades, it is cognizant of this risk and it builds vessels catering to the small medium OSV segment which is the largest market among OSVs. This should mitigate risk to a certain extent.
Lumpy revenue / net profits
For its build-to-stock model, all the work to date is recognised immediately in revenue and profits upon the signing of firm sale orders. Future progress on build-to-stock shipbuilding program is recognized on a percentage-of-completion method. Thus, it is apparent that quarterly results can swing depending on the timing of vessel sales.
Average analyst TP: $0.350
According to Bloomberg, Nam Cheong trades at 8.6x FY13F PE vis-à-vis 7.8x FY13F PE for Vard Holdings. However, most analysts believe that Nam Cheong’s results are likely to be stronger in FY13F and FY14F as opposed to weak results from Vard Holdings.
Here are the various analyst target prices. The average is $0.350. 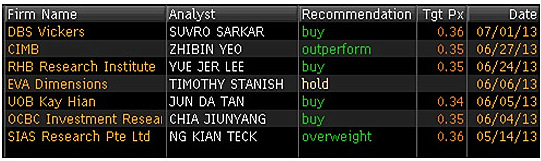
Chart analysis
Nam Cheong has traded in a seven-month range from $0.240 to 0.290 since 14 Dec 2012. It closed at $0.280 on last Friday. Day's high and low were $0.280 and $0.270, respectively. Near-term support and resistance are at $0.265-0.270 and $0.280, respectively. It is noteworthy that it has been testing $0.280 recently and it is likely that the more times it tests $0.280, the more likely it can breach past $0.280. The next resistance is seen at $0.290.
For stocks which trade within a range, it typically takes some good news (perhaps in the form of contract wins; good results etc) to propel them higher. If it breaches 0.290 with volume expansion, an eventual technical measured target price is around $0.340. Notwithstanding this, chart reading is subjective and may have different interpretations by different people.
Conclusion
This is just an introduction to Nam Cheong. Readers who are keen to know more about Nam Cheong should visit the company website, read the company annual reports, latest financial results and announcements etc. There are also informative analyst reports. Readers can email me at
P.S: I have mentioned this company informally to my clients in Sep 2012 (trading at $0.200); Dec 2012 ($0.240); Apr 2013 ($0.245) and recently Jul 2013 ($0.265). Finally, I have the time to sit down and do a writeup on this company on my blog.