Excerpts from latest analyst reports….

Kim Eng Securities says Stamford Tyres could do even better this FY
Analyst: Gregory Yap
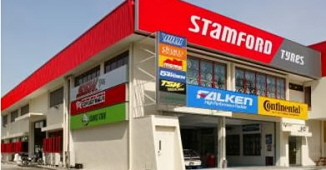
Background: Stamford Tyres is a global distributor and retailer of tyres, wheels and car accessories. It distributes Continental, Falken and Toyo tyres, as well as its own Sumo tyres and SSW rims. It has operations in Singapore, Malaysia, Thailand, Indonesia, Hong Kong, China, India, Australia and South Africa.
Recent developments: Stamford reported a convincing turnaround from FYApr09. However, FY Apr10 net profit of $9.4m included a $3.2m provision for the mining tyre business (where it wrote off its entire large earthmover tyre inventory). As a result, adjusted net profit should be $12.6m, back to above its results of three years ago in FY Apr07.

Results should be better this year. In addition to the provision, which was one‐off, Stamford suffered losses of $1.2m from the wheel plant in Thailand and $0.6m from the Indian market.
But management is confident that the Thai operations will break even this year given a full orderbook for the next three months.
In India, it intends to scale back operations and expects losses to be substantially reduced.
Assuming stable operations elsewhere (ie, Stamford does not suffer a cut in country allocation or higher raw material costs), we would expect FY Apr11 to be a better year.
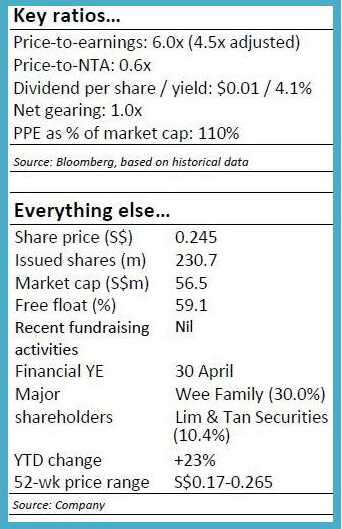
Stock trades below hard replacement value. With a market capitalisation of $56m, Stamford trades below its fixed assets value of $63m and just 0.6x book value of $98m.
Arguably, the company is worth more as book value does not include the intangible value of its long‐standing relationships with its tyre principals Sumitomo and Continental, which date as far back as 1975.
Recent story: STAMFORD TYRES' stock price up 11.4% on FY10 earnings surge report
UOB Kay Hian says Man Wah had a high Return on Asset of 42%
Analysts: Greater China Consumer Team

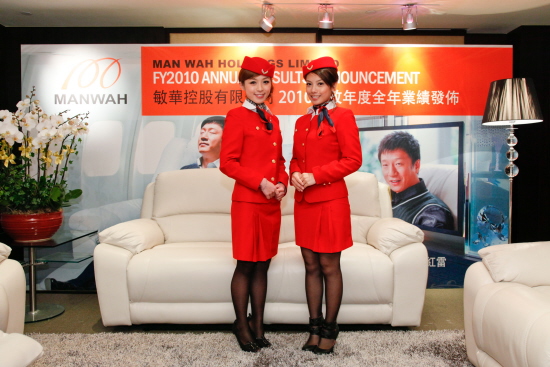
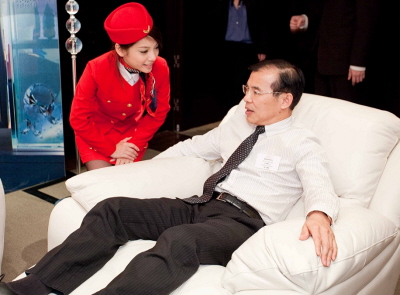
Man Wah (MW), under its brand “Cheers”, produces and sells recliner sofasto China and overseas via its self-run stores and distributors’ stores. It also produces and sells bedding products under the brand “Enlanda”.
♦ Leading recliner sofa brand in China. The Group is the definite leader in China’s recliner sofa market with its 16.2% market share, much largerthe combined market share of 9.3% for the next four players. We believe the Group’s much larger sales relative to major competitors and its extensive retail network represent a formidable cost advantage in the industry.

♦ Exposed to China’s furniture market. As China’s largest recliner sofa producer, MW is geared to benefit from the burgeoning growth in the recliner sofa market. Euromonitor estimated that total retail sales ofrecliner sofas in China will grow at a CAGR of around 30% from 2009 to2013.
♦ Rapid expansion in retail network. To tap the briskly growing market inChina, the Group is going to expand its retail network. The Group intends to increase its sales network to approximately 1,000 stores on top of approximately 500 at end-09. We believe the Group’s retail network has reached the critical mass, and it is set to enjoy better economies of scale from a further expansion.
♦ Gaining market share in overseas markets. The Group has been gaining market share in overseas markets in recent years, which we believe was due to its penetration into those markets, the trading-downtrend in developed countries and the wipe-out of small players after the global financial crisis.
♦ Risk factors. We believe the appreciation of the renminbi and probable trade protectionism imposed by western countries constitute the major risks for the company, as exports accounted for 70% of its total sales and profit for FY10 (year ended 31 Mar 10).
♦ Valuation. Based on consensus earnings forecasts, MW is trading at around 10x, roughly in line with domestic peers. Based on the consensus estimate, MW is trading at 10x 1-year forward PE, roughly in line with its peers in Asia Pacific. It is worth noting that MW had areported ROA of 42%, much higher than both domestic peers and global peers.
Recent story: MAN WAH'S FY10 profit soars 171% to 617 mln hkd


