| After a sterling 2019 (net profit: S$24.1 million, +19.6% y-o-y), CSE Global entered 2020 with its highest order backlog in five years. At $307 million, the starting orderbook is set to turn this year's revenue and profitability into pretty nice results. Historically, in the past five years, CSE has achieved annual revenue that is 2X, on average, the year's starting orderbook (see chart). This reflects the order inflow that takes place throughout the year and which is then executed. Some orders stretch longer term and spill over into the following year. 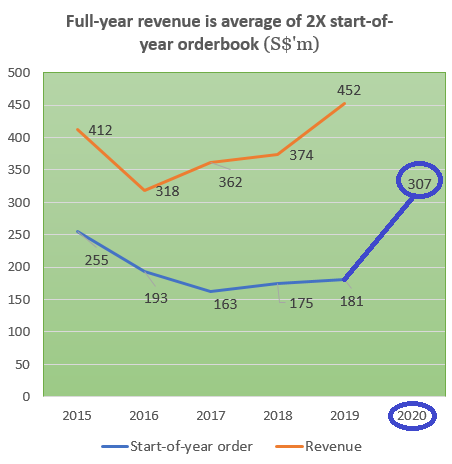 The revenue-to-starting orderbook multiple was 1.6, 1.7, 2.2, 2.1 and 2.5, respectively in 2015-2019. Thus, the average was 2.0. The revenue-to-starting orderbook multiple was 1.6, 1.7, 2.2, 2.1 and 2.5, respectively in 2015-2019. Thus, the average was 2.0. NextInsight compilation For example:
|
 FY19 results conference call (L-R): CFO Eddie Foo | Non-executive Chairman Lim Ming Seong | MD Lim Boon Kheng. Photo by Ngo Yit Sung
So, given how full-year revenue runs ahead of starting orderbook in the past 5 years, one may guess that the 2020 revenue could perhaps be 2X larger than the order backlog of $307 million.
The forecasts by analysts are:
|
Research house |
Analyst |
2020 Forecast Revenue |
2020 Forecast Net Profit |
Target stock price |
|
RHB |
Jarick Seet |
$533 m |
$29 m |
73 c |
|
CGS-CIMB |
Cezanne See |
$548 m |
$28.5 m |
77 c |
|
DBS |
Lee Keng LING |
$594 m |
$29.5 m |
70 c |
|
NextInsight compilation. |
||||
The order backlog from 2019 derives from a record string of orders totalling S$578.8 million (+52.1% YoY) in 2019.
Contributors included US-based Volta LLC (acquired in Oct 2019) as well as two large projects in the oil & gas sector.
On homeground, CSE was also awarded business by the Singapore government (project details are hush hush), and management guided that 2020 is likely to bring more orders from the government.
Group gross margin in FY19 was 27-28%, and management guided that this is sustainable in 2020.
At the FY19 results teleconference, CSE management affirmed its expectaction of a steady flow of orders every quarter in 2020. It is also targeting large greenfield projects in the oil & gas and infrastructure segments.
| Operating cashflow to stay positive | ||||||||||||||||
There were S$73.2 million of acquisitions in 2019 and dividend payments of $14.0 million And the operating cashflow in 4Q2019 was -$1.8 million. CFO Eddie Foo attributed this to funding for working capital of some Singapore projects and the start of some US projects. However, for the full year, the operating cashflow was +$18.0 million (2018: $56.6 million). In 2020, most of the businesses of CSE will continue to generate positive cashflow, added Mr Foo. CSE has proposed a final dividend of 1.50 cents/share to be paid on 12 May 2020. The interim dividend already paid amounted to 1.25 cents/share. The total dividend of 2.75 cents has been a consistent feature in the past five years. |
||||||||||||||||
The PowerPoint presentation for FY19 results is here.