"Money Plant" contributed this article to NextInsight. She owns shares in Straco, has not met management, and her forecasts are based on various assumptions as stated below.
|
Key investment highlights:
Potential catalysts: rise in dividends, new acquisitions |
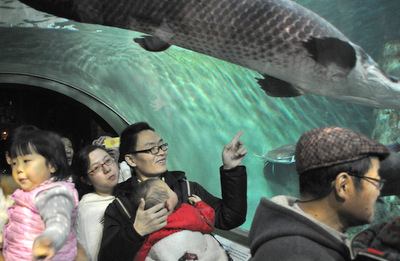 @ Shanghai Ocean Aquarium.
NextInsight file photo.1Q17 financial results - to be frank, I don’t find it fantastic.
- Sales rose 4.2% yoy as visitorship rose 7.8% yoy to 1.07m in the quarter. PBT grew 8.8% yoy or S$1.1m; however, part of the profit growth was driven by lower sales and marketing expense due to lower sales tax and lower advertising expense (S$0.66m). Tax is something out of the group’s control, advertising expense is a must spend to drive traffic - so I won't look at it as recurring savings.
- If we exclude the savings from lower sales and marketing expense, PBT only grew 3.4% yoy to S$12.6m (quite comparable to S$12.4m in 1Q15. But note that sales in 1Q17 was 9.5% higher than 1Q15 - main culprit being staff cost)
Upcoming 2QFY17 results. Flattish or positive outperformance?
- 2QFY16 profit fell 11.6% yoy on the back of a 5% drop in sales due to lower sales from Shanghai Ocean Aquarium and Underwater World Xiamen.
- In 1QFY17, the Shanghai Ocean Aquarium saw double-digit growth in visitorship yoy, and visitorship to Underwater World Xiamen grew 9.3% yoy.
- Disneyland Shanghai opened in June 2016. Straco may see a very positive yoy comparison in 2QFY17 for its Shanghai asset (which may enjoy the spillover impact this year). Shanghai Disneyland welcomed its 10 millionth visitor in May 17. In Xiamen, Straco's aquarium had a very positive start in 1Q17, which hopefully will continue into 2Q17.
|
Deriving a target price of $1.02 |
||
|
Mkt cap (S$'m) |
730.16 |
|
|
Less net cash |
(110.0) |
|
|
Less net cash produced from 2Q17F-4QFY17F |
(39.01) |
assume same FY17F FCF generated is S$50m (FY16 FCF: S$67m, FY15 FCF: S$60m), assume S$10m extra in capex spent for FY17 on asset enhancement program (2.5x more than typical maintenance capex), assume no payout of dividends – since we will be entitled to it anyway if we buy now 1QFY17 free cash flow: S$11m |
|
Add MI |
9.1 |
As at end of 1Q17 |
|
EV |
590.3 |
|
|
|
|
|
|
FY17F EBITDA S$m |
81.61 |
assume same as FY15 (which is 10% yoy growth from FY16) |
|
EV/EBITDA |
7.23 |
|
|
|
|
|
|
Target EV/EBITDA |
9.00 |
|
|
EV |
734.49 |
Multiply by FY17F EBITDA of $81.6m which we assume same as FY15 |
|
Add potential net cash less MI (S$m) |
139.83 |
|
|
Potential market cap S$m |
874.32 |
|
|
Target price |
$1.02 |
|
12M fair value range is $1.02-1.11 based on 9-10x FY17F EV/EBITDA.
If stock does not enjoy a valuation re-rating, I expect it to be at least S$0.97 by end of FY17 - being 8.5x EV/FY17F EBITDA which is its current valuation now. However, a valuation re-rating may be justified should Straco buy a new asset or raise its dividend payment (which it can more than afford to do so).
Based on FY16 DPS of S$0.025, it currently trades at 3% yield, which is near its 10-year average.
- Should management raise its dividend by 0.5 or 0.75 cent by end of year, the dividend yield rises to 3.5-3.8% (based on share price of S$0.85) - immediately pushing the stock to its +1SD of its 10-year range.
- Should dividend yield then compress back to 3% (the 10-year average range) it will translate into a stock price of S$1-1.08.
See below for more details
1. Valuation is cheapest since 2014. Trading near the lowest EV/EBITDA of 8.4x since 2014. (And will only get cheaper as cash accumulates, assuming net income stays constant etc)
|
|
Trading at 15.7x FY16 PE Ex-cash, 13.4x FY16 PE which is not that bad given its steady cashflow and operating performance in the past.
Should dividend be raised by S$0.005 or 0.0075 by end of year, the dividend yield rises to 3.5-3.8% (based on share price of S$0.85) - immediately pushing the stock to +1SD of its 10-year range. |
2. Very good cashflow business- 8-9% free cashflow yield (which can be used to accumulate in balance sheet for M&A or pay dividends) + strong net cash position of S$0.128/share as at 31 Mar 17 (vs share price of S$0.85) - note this is also an all-time high since 2006 - and will grow if there is no major capex etc.
The business nature (a cash consumer retail business) requires very little maintenance capex for the operations (capex has ranged from S$0.8m to S$3.8m per year from FY06-FY16).
- Although Straco is embarking on major asset enhancement programs for its attractions in 2017/2018 (according to AR16) – that may increase capex in the near term but may help boost profit in the future (maintain competitiveness of assets and potentially higher ticket prices too?)
S$m (YE 31 Dec)
2011
2012
2013
2014
2015
2016
Net Income
16.526
19.732
34.095
37.688
49.000
46.464
Depreciation & Amortization
4.697
4.734
3.947
4.616
11.367
11.352
NI + Dep & Amort
21.223
24.465
38.042
42.304
60.367
57.815
Cash from ops/
(NI + Dep & Amort)108.5%
118.6%
98.6%
98.1%
107.3%
123.0%
Cash From Operations
23.018
29.010
37.523
41.482
64.775
71.137
Capital Expenditures
-1.299
-1.135
-1.437
-1.228
-3.855
-3.752
Free Cash Flow
21.719
27.874
36.087
40.254
60.920
67.385
Cash from operations closely mirror that of Net income + Depreciation & Amort, given that this is a highly cashflow generative business
2011
2012
2013
2014
2015
2016
Net income yoy growth
-11%
19%
73%
11%
30%
-5%
Operating cash flow yoy growth
-15%
26%
29%
11%
56%
10%
FCF yoy growth
-18%
28%
29%
12%
51%
11%
2011 declined yoy due primarily to a decline in revenue at Shanghai Ocean Aquarium in the absence of the World Expo. There was still a 12.6% growth in overall visitor numbers to all main attractions in FY11. Straco generated S$60-67m (or S$0.07-0.078/share) of free cash flow per annum in FY15 and FY16 respectively (8-9% free cash flow yield!)
Strong profit growth record. With the exception of FY11 and FY16, Straco has grown its net profit by more than 10% p.a. via inorganic and organic means. In FY11, there was an absence of the World Expo event that helped boost FY10 profit by 111%. FY16 was affected by typhoon and visitors’ restriction at Xiamen. - Assets are not operating at full capacity yet -- eg. Shanghai Ocean Aquarium (Straco’s flagship attraction) is designed to host 21,000 visitors a day (or 6.3m visitors a year, assume 300 days). The total number of visitors to ALL of Straco’s assets were only about 5m for FY15 and FY16. There is room for organic growth.
- For 1QFY17, visitations to all attractions rose 7.8% yoy to 1.07m. Straco saw double digit growth in visitors to Shanghai Ocean Aquarium and 9.3% growth to Underwater World Xiamen. Visitors to Singapore Flyer remained stable.
However, growth sort of stagnated in FY16 and FY17 (which may be why co. is looking to do asset enhancement). Nonetheless, expect flattish performance at least until the asset enhancement is done (unless management can control costs – see comments on 1QFY17 financial results) or buy a new asset.
Waiting for the next acquisition? With net cash of S$110m, management is ready for its next acquisition (after Singapore Flyer in 2014). It has an excellent track record in acquisitions.
When Straco acquired Singapore Flyer (90%) it had a net cash position of about S$108m at end of FY13. Since then its net cash position has rebounded to S$102m at end of FY16 (while paying dividends of S$0.02-0.025/share from FY14-FY16).
|
2011 |
2012 |
2013 |
2014 |
2015 |
2016 |
|
|
Free Cash Flow |
21.7 |
27.9 |
36.1 |
40.3 |
60.9 |
67.4 |
|
Dividends Paid |
(6.5) |
(6.5) |
(10.5) |
(16.9) |
(17.2) |
(21.5) |
|
FCF after paying dividends |
15.2 |
21.4 |
25.6 |
23.3 |
43.8 |
45.9 |
|
Net Debt |
(82.2) |
(96.0) |
(108.1) |
(19.1) |
(61.6) |
(102.3) |
|
Net Debt Per Share |
(0.096) |
(0.114) |
(0.128) |
(0.023) |
(0.072) |
(0.119) |
*FY14: Acquired Singapore Flyer, hence a drop in net cash from $108m to $19.1m. Look at how fast the money got replenished!
In the management’s own words from AR16 pg 3: “We remain on the lookout for good projects to build or acquire, and continue to assess potential tourism investments, but until we come across the rare opportunity that is a true step forward in terms of quality, scale and potential returns, we will remain prudent in matters of cash management”
Good track record of acquisition:
- Acquired UWX in Xiamen in 2007 for S$12.3m. While Straco does not break down the performance of its aquarium assets, UWX had about 600,000 visitors annually back in 2007 (see AR 07). It was stated in AR11 that visitorship had crossed 1m for the first time, aided by the rising popularity of Xiamen with the addition of fast speed rail link between Fuzhou and Xiamen. (That is a 66% increase in visits since Straco acquired it in 2007)
- Acquired Singapore Flyer at end-Aug 14 for S$140m
- a very good deal, considering it cost S$240m to build, and was only 6 years old at point of sale (At point of purchase, the wheel had a useful life of 35 years and 7 months being the period it is being depreciated). Assuming, when it was built, a useful life of about 40 years, annual depreciation was about S$6m. With purchase price of S$140m, annual depreciation to JV (where Straco owns 90%) is only about S$4m (an immediate saving of S$2m in depreciation a year!)
- When Straco acquired it, the Singapore Flyer was in the midst of a receivership as it was loss making due to poor management. Straco has managed to turn around the operations.
- Singapore Flyer contributed S$10.8m to Straco in FY16 PBT. In FY15, it helped to drive a 19% rise in profit on its full year of contribution.
- a very good deal, considering it cost S$240m to build, and was only 6 years old at point of sale (At point of purchase, the wheel had a useful life of 35 years and 7 months being the period it is being depreciated). Assuming, when it was built, a useful life of about 40 years, annual depreciation was about S$6m. With purchase price of S$140m, annual depreciation to JV (where Straco owns 90%) is only about S$4m (an immediate saving of S$2m in depreciation a year!)
If there is no acquisition, are higher dividends possible? Does Straco have the ability to increase its dividend? YES!
- FY16: While the dividend payout ratio (as % of net income) is 46% but as a % of free cash flow, it's only 32%.
- Every 0.5-cent increase in dividend (20% increase from FY16 DPS of 2.5 cent) translates into a cash requirement of S$4.3m or 6% of FY16 free cash flow.
- As at 31 Mar 17, Straco had S$110m of net cash or 12.8 cents/share. (That’s S$7.6m or 0.9 cent/share of net cash accumulated just from 31 Dec 16)
|
2011 |
2012 |
2013 |
2014 |
2015 |
2016 |
|
|
ordinary |
0.0075 |
0.0075 |
0.0125 |
0.0200 |
0.0200 |
0.0250 |
|
special |
0.0050 |
0.0075 |
0.0050 |
|||
|
total dividend |
0.0075 |
0.0125 |
0.0200 |
0.0200 |
0.0250 |
0.0250 |
|
yoy increase |
0.0% |
66.7% |
60.0% |
0.0% |
25.0% |
0.0% |
|
dividend yield |
0.9% |
1.5% |
2.4% |
2.4% |
2.9% |
2.9% |
|
no. of shares (as at end of year excluding treasury shares) |
860.07 |
842.06 |
843.74 |
847.46 |
855.64 |
859.01 |
|
EPS |
0.0192 |
0.0234 |
0.0404 |
0.0445 |
0.0573 |
0.0541 |
|
FCF/share |
0.0253 |
0.0331 |
0.0428 |
0.0475 |
0.0712 |
0.0784 |
|
DPS/EPS (earnings payout ratio) |
39.0% |
53.3% |
49.5% |
45.0% |
43.7% |
46.2% |
|
DPS/FCF per share |
29.7% |
37.8% |
46.8% |
42.1% |
35.1% |
|
How likely will Straco increase its dividend? I think, highly likely this year.
- Based on the recent years dividend pattern of Straco, it has been increasing dividends every alternate year.
- Note that major shareholders/management owns 54.7% of the company, giving them an incentive to raise dividends too.
Given the strong cash flow, and past dividend pattern, we believe it is likely that Straco may raise its dividend by 0.5-0.75 cent a share for this coming year. A DPS of 3-3.25 cent will translates into a dividend yield of 3.5-3.8%.
|
Potential privatisation candidate:
|